2.9 KiB
2.9 KiB
Elastop - Elasticsearch Terminal Dashboard
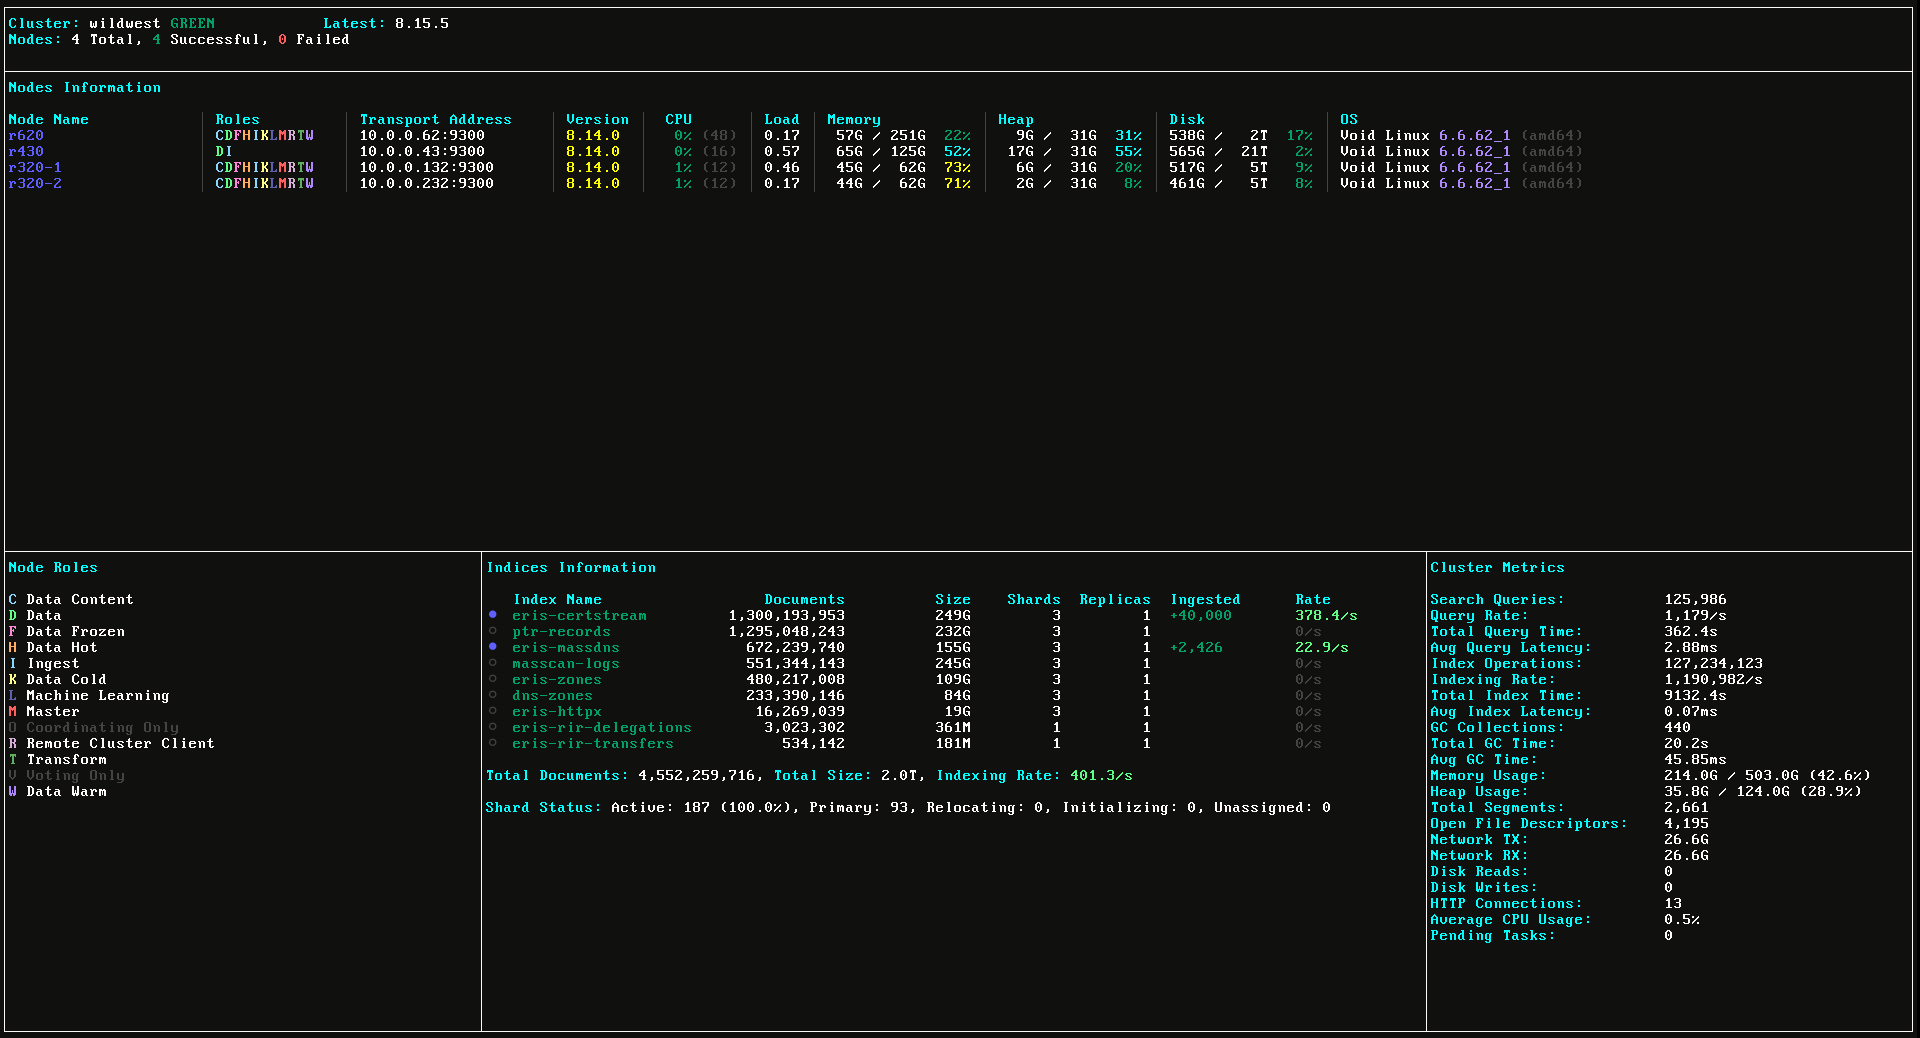
Elastop is a terminal-based dashboard for monitoring Elasticsearch clusters in real-time. It provides a comprehensive view of cluster health, node status, indices, and various performance metrics in an easy-to-read terminal interface. This tool was designed to look visually similar HTOP.
Features
- Real-time cluster monitoring
- Node status and resource usage
- Index statistics and write rates
- Search and indexing performance metrics
- Memory usage and garbage collection stats
- Network and disk I/O monitoring
- Color-coded health status indicators
- Role-based node classification
- Version compatibility checking
Installation
# Clone the repository
git clone https://github.com/acidvegas/elastop.git
cd elastop
go build
Usage
./elastop [flags]
Command Line Flags
| Flag | Description | Default |
|---|---|---|
-host |
Elasticsearch host | localhost |
-port |
Elasticsearch port | 9200 |
-user |
Elasticsearch username | elastic |
-password |
Elasticsearch password | ES_PASSWORD |
Dashboard Layout
Header Section
- Displays cluster name and health status
- Shows total number of nodes (successful/failed)
- Indicates version compatibility with latest Elasticsearch release
Nodes Panel
- Lists all nodes with their roles and status
- Shows real-time resource usage:
- CPU utilization
- Memory usage
- Heap usage
- Disk space
- Load average
- Displays node version and OS information
Indices Panel
- Lists all indices with health status
- Shows document counts and storage size
- Displays primary shards and replica configuration
- Real-time ingestion monitoring with:
- Document count changes
- Ingestion rates (docs/second)
- Active write indicators
Metrics Panel
- Search performance:
- Query counts and rates
- Average query latency
- Indexing metrics:
- Operation counts
- Indexing rates
- Average indexing latency
- Memory statistics:
- System memory usage
- JVM heap utilization
- GC metrics:
- Collection counts
- GC timing statistics
- I/O metrics:
- Network traffic (TX/RX)
- Disk operations
- Open file descriptors
Role Legend
Shows all possible node roles with their corresponding colors:
- M: Master
- D: Data
- C: Content
- H: Hot
- W: Warm
- K: Cold
- F: Frozen
- I: Ingest
- L: Machine Learning
- R: Remote Cluster Client
- T: Transform
- V: Voting Only
- O: Coordinating Only
Controls
- Press
qorESCto quit - Mouse scrolling supported in all panels
- Auto-refreshes every 5 seconds
